SYSTEM DEVELOPMENT
SYSTEM
- A set of components that interact with each other to form as a whole.
- Work together toward achieving a common goal
ATTRIBUTE
- Contains qualities and capabilities not found in the individual elements.
Components of a System
1. Input - anything that enters the system.
2. Output – anything that leaves the system goal or purpose for which the system exists.
3. Process – transforms input into output.
4. Feedback – reintroduces a portion of the output of a system as an input into the same system.
Elements of a System
1. Purpose – the reason it exists.
2. The reference point for measuring its success
3. Subsystems - parts or elements which perform specified tasks that are compatible with the goals of the larger system of which these are parts.
4. Environment – the people, facilities, rules, policies, and regulations that surround a system.
5. Boundary – the perimeter or line of demarcation between a system and the
environment.
6. Connections – transmit the flow of material and information that coordinate the system’s components.
Systems Concept
- Business System
A collection of policies, procedures, methods, people, machines, and other elements that interact and enable the organization to achieve its goals.
- Information System
A collection of procedures, programs, equipment, and methods that process data and make it available to management for decision-making.
Components of Information System.
- Work practices – methods and procedures used by people and technology to perform work.
- Information – can include formatted data, text, images and sounds.
- People – people who enter, process and use data.
Reasons for the need of an Information Sistem.
- Growing size of the organization and the no. of competitors.
- Growing ability of computers to process large amount of data with great speed.
- Dramatic increase in volumes of data generated.
- Advances in communication technologies to permit faster data communication
- Much more sophisticated technology today
Characteristics of Information Systems
An analyst learns about an information system by asking questions about the system and how it supports business operations. As a systems analyst, you might ask the following questions as you complete your work:
1. Does this system interact with other system?
For examples, a purchasing system generates orders that become input for a production system. Each system interacts with a finance system that monitors the company’s profitability. A breakdown in any one system can affect companies rely on telecommunications and the Internet for mission-critical systems.
A company’s information system also can interface with a system operated by another firm, such as when a payment is made by one company’s accounts payable system to another company’s accounts receivable system. This process, known as electronic data interchange (EDI), involves the computer-to-computer transfer of data between companies. EDI has
expanded rapidly as companies form closer working relationships with their suppliers and customers. In the past, EDI was used mainly for processing transactions between two companies, such as purchasing or payments. Toda, EDI can help a firm plan its production, adjust inventory levels, or stock up on raw materials using data that comes from another company’s information systems.
2. What are the system’s boundaries? A system boundary indicates where one system ends and another system begins. The boundary between two systems is not always clear-cut. For example, when are customer payments part of the accounts receivable system, and when
are they included in the finance system? If customer payments need to be adjusted, must the adjustments take place in both systems? Who makes the adjustments? What processes and files are involved? Complex systems have many interfaces with other systems; the
system analyst must carefully plan and design theses systems to design their boundaries correctly.
3. Will the system handle specialized business needs? Many firms require specialized systems for information management that is unique to their company or industry. At a college, for example, specialized systems handle class registration, classroom scheduling, and student grading. At a hospital, specialized systems manage patient admissions, room scheduling, and insurance billing. Firms in the banking, insurance, airlines, and telecommunications industries require complex systems to run their businesses. If a specialized system is available as a vertical software package, a company can purchase and
customize the package. Otherwise, a company must develop specialized in-house systems.
4. What size is the company, and what growth is forecast? Large and small companies in the same industry have different information systems requirements. For example, banks range in size from local operations with one or two branches to multinational banks with branches in many states and foreign countries. All banks handle loan processing and checking accounts. A multinational bank, however, has a much higher volume of customers, transactions, and accounts. A large bank’s systems are more complex because they consolidate information from banking centers around the world, handle currency exchange issues, and offer a wide array of products and services.
Who develops Information Systems?
Traditionally, a company either developed its own information systems, called in house applications, or purchased systems called software packages from outside vendors. Today, the choice is much more complex. Options include Internet-based application services, outsourcing, custom solutions from IT consultants, and enterprise-wide software strategies.
Regardless of the development method, launching a new information system involves risks as well as benefits. The greatest risk occurs when a company tries to decide how the system will be implemented before determining what the system is supposed to do. Instead of putting the cart before the horse, a company must begin by outlining its business needs and identifying possible IT solutions. Typically, this important work is performed by systems analysts and other IT professionals. A firm should not consider implementation options until it has a clear set of objectives. Later onas the system is developed, a system analyst’s role will vary depending on the implementation option selected.
The Purpose or Goal of Developing an Information System
1. To Solve a Problem
2. To Get Opportunities
3. To Complete the Instruction
The Organization Expectations after Implementing an Information System
1. Performance
Performance of the new system are effective. Performance can be measure from throughput and response time. Throughput it means amount from activity can do at mean time. Respond time are average delayed of time between two transaction or activity add with time to respond that activity.
2. Information
Increase quality of information can make the organization growth well. This is like our company have update information about accountancy. If our company want to improve the quality of information, we must discover a lot of resource and publish it. So good of information that we have, it will increase our growth organization.
3. Economy
In aspect economy it mean benefit from profit we have or reduction of cost used for our organization. In organization always had a profit from selling the product and always had a excreation of organization like salary of employee, pay electricity and any others thing. So economy of organization depend of benefit from organization profit and reduction of cost used for organization.
4. Control
In our organization need to control the detect and fix the problems. It mean after we development the new system we must control every time, we check our system are work so well or not. If our system not work like our plan, we mus find the problem and solve it. Good system came from good control of the system and can solve the problems.
5. Efficiency
Efficiency need in organization because it can make organization useless of resource like if our organization work in accountancy. In old system we must pay an accountant to work in our organization for one job. If our organization had a much job we must pay much accountant to. If we use new system work in computer, we just need a administrator and user to input the data. So if we use new system we can efficiency the cost for pay accountant. Efficiency can measure from output devide by the input.
6. Services
Services in this aspect mean increase about services give from the system. So system have services to support our ourganization like system work fast and precise calculation.
SYSTEM DEVELOPMENT LIFE CYCLE
• Organization use a standard set of steps, called system development methodology, to develop and support their information systems.
• Like many process, the development of information system often follows a life cycle. created – tested – introduced to the market. Its sales increase, peak, and decline.
• Finally, the product is removed from the market and replaced by something else.
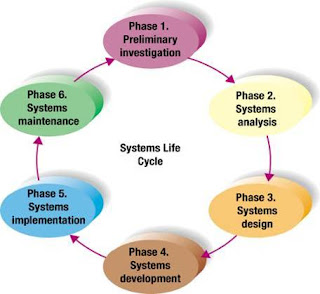
SDLC marks the phases or steps of information system development as show in a figure below. The specific steps and their sequences are meant to be adapted as required for a project.
Spiral approach of system development
• The circular nature of the life cycle diagram illustrates how the end of the useful life of one system leads to the beginning of another project that will replace the existing system altogether.
• This concept is clearly brought out with the diagram shown next. Each of these phase has specific outcomes and deliverables that feed important information to other phases. At the end of each phase, the systems development reaches a mile stone.

Waterfall Model
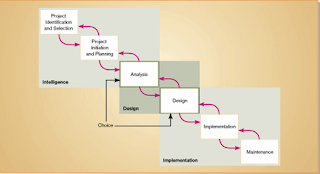
SDLC used in an Organization is an orderly set of activities conducted for each development project
In SDLC each phase has specific outcomes and deliverables that feed important information to other phases. At the end of each phase, a system development project reaches a mile stone.
Iterative Model
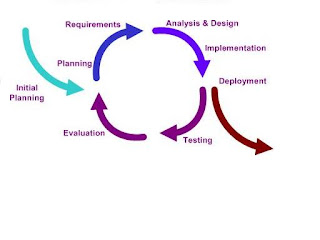
Iteratif Model here same with waterfall model, here found same processes, like requirement, design, implementation, and testing (verification).
Phases of the Systems Development Life Cycle

• Systems Planning and Selection
– Two Main Activities
• Identification of need
• Investigation and determination of scope
• Systems Analysis
– Study of current procedures and information systems
• Determine requirements
• Generate alternative designs
• Compare alternatives
• Recommend best alternative
• System Design
– Logical Design
• Not tied to any specific hardware /sys.sw platform
• Concentrates on business aspects of the system
– Physical Design
• Technical specifications
• Decides which programming languages to be used
• Decides which HW platform, which OS to be used
• The final product of the design phase is presented in a form such as diagram or written report ready to turned over to programmers and other system builders for construction.
• Systems Implementation and Operation
– Implementation
• Hardware and software installation
• Programming
• testing
• User Training
• Documentation
– Operation
• System changed to reflect changing conditions
• System obsolescence
Detailed Notes on SDLC
1. System planning and selection Phase:
• This phase has two important activities.
– The first activity involves in identifying the need for a new or enhanced system. Information needs of the organization are examined and system to meet these needs are identified. Then the Analyst evaluates priorities and brings out the needs into a written plan.
•
– During this phase, based on the feasibility study, the management determines whether to take up the systems development.
• Once decided to take up, a specific plan will be produced for the proposed project. The plan specifies the time and resources needed for its execution of the project.
Preliminary Investigation.
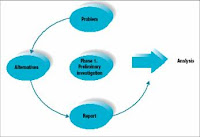
- Preliminary Investigation includes:
- Define the problem
- Suggest alternative systems
- Prepare a short report
2. System Analysis Phase:
Analysis expands the Strategy Stage into details that ensure business consistency
and accuracy. The Barker analysis stage is designed to capture all of the business processes that need to be incorporated into the project. Barker divides Analysis into two components: Information Gathering and Requirements Analysis. Information Gathering: includes the building of more detailed ERD called an Analysis ERD (equivalent to what I called a logical model), process and data flows, a requirements document, and an analysis evaluation. This step also includes an analysis of the existing legacy systems.
Much of the information gathering is accomplished via interviews with users. As discussed in the next chapter this is accomplished by understanding the user interface and determining whether to do individual and/or group analysis techniques. Requirements Analysis: Once the information gathering is complete a detailed requirements analysis or specification documents must be produced. It contains the relevant tools as outlined in my analysis document, namely, the detailed PFDs, DFDs, ERDs and Process Specifications. In the Barker approach the requirements document may also include audit and control needs, backup and recovery procedures, and
first-level database sizing (space needs).
• In this phase, the systems analyst understands the organizations existing procedures and then suggest an information system as solution. This Analysis phase has several sub phases,
– Involves determining the requirements of the system. System analyst work with the users to determine what the users want from the proposed system.
– Study the requirements and structure them.
– Generate alternative information system based solutions
– Compare these alternatives to determine which is best in satisfying the requirement – considering the cost, labour and technical levels the organization is willing to commit.
– Select a solution.
Six-phase problem-solving procedure for examining and improving an information system:
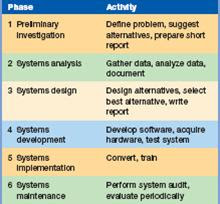
Analysis tasks include:
- Gathering data
- Analyzing the data
- Document systems analysis

Analyzing the Data
- Checklist
- Top-down analysis method
- Grid charts
- Decision tables
- System flowcharts
- Data flow diagrams
- Automated design tools -CASE
Grid chart

Decision table

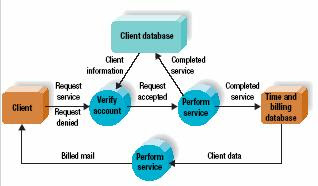
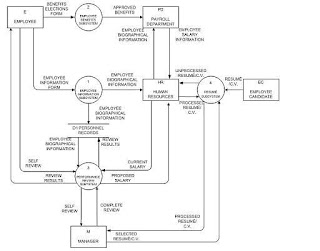
Data flow diagram
System flowchart

The analysis phase of the systems development life cycle (SDLC) begins with the creation of information-gathering channels. Such channels include documentation, interviews, observation, questionnaires, and measuring. Documentation can help establish what the old system does and how it works. Interviews are a great way to gather information because you can find out exactly what makes an end-user happy. Observation can add insight and out-of-the-box thinking to the mix. Questionnaires are great for collecting information from many people. Measuring is important because you will need to measure things like how much space the new system will take up or how many inputs/outputs will be needed. At this point, all requirements for the creation of the system should be noted.
Once the gathered information from the channels is analyzed, it is put into visual diagrams which include flow block diagrams, organizational charts, task templates, flowcharts, data flow diagrams, entity relationship diagrams, and state-transition diagrams. The most common diagram is a data flow diagram like this:
3. System Design Phase:
The Design Stage consists of the incorporation of physical appearances and other requirements that are specific to actual products, for example, coding and naming conventions. The typical design needs are screen layouts, navigation tools (menus, buttons, etc.) and help systems. The Design Stage must also ultimately achieve the agreed upon performance or service levels.
The ERD will be transformed to a physical database design. Detail specifications will be translated into program modules, and manual procedures to operate the system should be documented. In terms of screens, reports, and “bridges” that
connect modules, various prototype designs can be incorporated to show users how the navigation and physical “look and feel” will occur during the user interface. As previously discussed, Design is not a step that occurs without iteration.
The Design Stage often iterates with analysis, where questions and suggestions from designers can raise issues about alternatives not considered during the analysis stage What is critical about this design method is its interactive yet interdependence with non-application components such as network design, audit and control, backup and recovery design, data conversion, and system test planning.
• During design phase the recommended solution is converted into logical and then physical system specifications. The designing team will design all aspects of the system such as input & output screens, reports, databases and computer processes.
• Logical design is not tied to any specific hardware and systems software platform. Conceptually, the system design could be implemented on any hardware and system software. Logical design concentrates on the business aspects of the system, that is how the system will impact the functional units with in the organization.
• As the next stage, the logical design will be converted into physical design. The team will design the various parts of the system to perform physical operations necessary to facilitate data capture, processing and information output. Then during this part, the analyst decides on the programming languages and database system, hardware platforms, and network environment. The final product of the design phase is the physical system specification, presented in a form such as diagram or written report, ready to be turned over to programmers for construction.
Design includes 3 major tasks:
1. Designing alternative systems
- Economic feasibility
- Technical feasibility
- Operational feasibility
2. Selecting the best system
3. Writing the systems design report

Once the analysis phase is complete and all requirements are established, it is time to record a rough draft of the system logic to be used for development. This is the design phase of the systems development life cycle (SDLC). The goal of the design phase is to generate system specifications. These system specifications satisfy requirements set earlier in the SDLC. They are presented as high level vs. detail and logical vs. physical.
There are several design strategies that can be used. Such strategies include outsourcing (both domestic and overseas), buying off-the-shelf, building in-house, or a combination of the three. In addition to the design strategies, special techniques are used. They are process modeling, data modeling, data modeling, computer-aided software engineering (CASE), and object-oriented design (OOD).
CASE tools represent software that allows for strategic creation of logic. An example of a CASE tool is Microsoft Visio. This CASE tool creates data flow diagrams and flowcharts to illustrate the logic of a system. This is a great way to demonstrate the specifications of a system and achieve the goal outcome of the design phase. Here is an example of a flowchart:

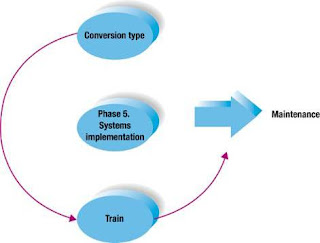
4. Implementation Phase:
• Implementation and operation Phase, is the final phase and it involves, implementation and operation.
• During this phase system specifications are turned out to a working system, tested and put into use.
• Implementation includes coding, testing and installation.
– During coding, programmers write the programs that make up the system.
– During testing, programmers and analysts test individual programs and the entire system in order to find and correct errors.
– During installation, the new system becomes a part of the daily activities of the organization. System implementation activities also include initial user support such as the finalization of documentation, training programs and ongoing user assistance.
• Once the system has been installed, the analyst team establishes a support plan. This is second part of the fourth phase of the SDLC is operation.
– After installation, users sometime find problems with systems and often request for improvements.
– During operation, programmers make changes that users ask for and modify the system to reflect changing business conditions. These changes are necessary to keep the system running and useful. The amount of time and effort devoted to system enhancements during operation depends a great deal on the performance of the previous phases of the life cycle.
• After few years, when the business environment changes, the system is no longer performing as desired, and the costs of keeping a system running become prohibitive, the systems will need a total change over. These problems indicate that it is time to begin designing the system’s requirement, there by completing the loop and starting the life cycle over again.
New system is installed and people are trained to use it:
Types of conversion
- Direct
- Parallel
- Pilot
- Phased
- Training
ApproachSystem Development
Found several approach to develop system, that is:
1. Classical approach vs structured approach (looked at from methodology that used).
2. Piecemeal approach vs system approach (looked at from target that be achieved)
3. Bottom-Up approach vs Top-Down approach (looked at from manner determines need fromsystem).
4. Total-system approach vs modular approach (looked at from manner develop it).
5. Great loop approach vs evolutionary approach (looked at from technology that used).
1. Classical Approach Vs Structured Approach
Classical Approach
Classical approach is approach insides system development that follow stages at system life
cycle without supplied with tools and techniques.
Troubleshoots that can emerge from approach classic, that is:
1. Software development will be difficult.
Classical approach less give tools and techniques insides develop system and as finally software development process becoming not directional and difficult to done by programmer.
2. Treatment cost or system maintenance will be more expensive.
The expensive treatment cost at classical approach caused system documentation that developed less complete and less structured.
3. Big error possibility system.
System not test during the development stage is principal source from system errors. Classical approach doesn't prepare to manner systems analysis to do testing system, so that system errors possibility will be bigger.
4. System success less well guaranted.
Emphasis from classical approach work from system developers staffs, not in system user. Because classical approach less involve system user in system development, so system user needs are less matching with the one which desirable and as finally system that applied less success.
5. System applications internal issue.
Because system user involvement under communication in system development stage, so only will know only in stage will applied. As finally system user will be startled and unaccustomed with bew system suddenly introduced.
Structured Approach
Structured approach equiped with tools and techniques that wanted in system development, so that end result from system that developed be got system the structure will be defined well and clear.
2. Piecemeal Approach Vs System Approach
Piecemeal approach
Piecemeal approach be to system approach development that emphasized at one particular activity or certain application. Activity that chosen, developed regardless of the position at information system or regardless of overall target from organization.
System approach
System approach pays information system as one integration unitary to each activity or the application. This approach also emphasized in overall goal achievement from organization, not only in that information target.
SYSTEMS DEVELOPMENT TECHNIQUES AND TOOLS.
In addition to understanding business operations, systems analysts must know how to use a variety of techniques, such as modeling, prototyping, and computer-aided systems engineering (CASE) tools, to plan, design, and implement information systems. They must be able to work in team environments where input from users, managers, and IT staff is synthesized into a design that will meet everyone’s needs. And they must be able to use
other software tools to illustrate accurately their designs and ideas.
1. Modeling
Modeling produces a graphical representation of a concept or process that systems developers can analyze the, test, and modify. A system analyst can describe and simplify an information system by using a set of business, data object, network, and process models. A business model, or requirements model, describes business functions that an information system must support. A data model describes data structures and design. An object model portrays the design and protocols of telecommunications links. A process model describes system logic and process that programmers use to develop necessary code modules. Although the models might appear to overlap, they actually work together to describe the same environment from different points of view. Modeling involves various techniques, such as data flow diagrams, entity-relationship diagrams, use cases, and unified modeling language. Those techniques are described in more detail in next Chapter.
2. Prototyping
Prototyping involves the creation of an early working version of the information system or its components. Just as an aircraft manufacturer tests a new design in a wind tunnel, systems analysts construct and review prototypes for a larger systems. Prototyping tests system concepts and provides an opportunity to examine input, output, and user interfaces before final decisions are made. The prototype can serve as an initial model that is used as a benchmark to evaluate the completed system, or the prototype itself can develop into the final version of the system. Either way, prototyping speeds up the development process significantly. A possible disadvantage of prototyping is that important decisions might be made too early, before business or IT issues are thoroughly understood. If a prototype is based on careful fact-finding and modeling techniques, however, it can be an extremely valuable tool.
3. Computer-Aided Systems Engineering
Computer-aided system engineering (CASE) is a technique that use powerful programs, called CASE tools, to help systems analysts develop and maintain information systems. CASE tools provided an overall framework for systems development and support a wide variety of design methodologies, including structured analysis and object-oriented analysis. Traditionally, systems developers differentiated between two CASE categories: upper CASE tools and lower CASE tools. Upper CASE tools support the modeling process and produce a logical design of the information system. Lower CASE tools speed the development process by generating source code based on the logical model. Today, many popular CASE tools combine upper and lower CASE features into a single product. CASE tools can boost IT productivity and improve the quality of the finished product. For example, developers use CASE tools to maintain design integrity, manage a complex project, and generate code modules that speed up implementation.
4. Joint Application Development and Rapid Application Development
In the past, the IT department typically developed information I systems and contacted users only when their input was desired or needed. Unfortunately that approach often left large communication gaps between system developers and users. Over time, many companies discovered that systems development teams composed of IT staff, user, and managers could complete their work more rapidly and produce better results. Two
methodologies became popular: joint application development (JAD) and rapid application development (RAD). Both approaches use teams composed of user, managers, and IT staff to complete projects. JAD involves team-based fact-finding techniques, while RAD is more like a condensed version fo the entire development process.
5. Other Systems Development Tools
In addition to CASE tools, a systems analyst uses various productivity tools or organize and structure the task of developing an information system.
In addition to word processing, spreadsheets, graphics tools, and presentation software, analysts use special purpose charting tools. A popular example is VISIO, which. A systems analyst can use Microsoft VISIO to draw flowcharts, data flow diagrams, network diagrams, and business process diagrams, among others.
OVERVIEW OF SYSTEMS DEVELOPMENT METHODOLOGIES
This section discusses the most popular methodologies for developing computer-based information systems. A popular, traditional method is called structured analysis, but a newer strategy called object-oriented analysis and design also is widely used. Each method offers many variations. Some organizations develop their own approaches or adopt methods offered by software vendors or consultants. Most IT experts agree that no single, best system development strategy exists. Instead, a systems analysis should understand the alternative methodologies and their strengths and weaknesses.
1. Structure Analysis
Structured analysis is a traditional systems development technique that is time-tested and easy to understand. Structured analysis evolves in a 1960s environment, where most systems were based on mainframe processing of individual data files. Because it describes the processing that transforms data into useful information, structured analysis includes data organization and structure, relational database design, and user interface issues. Structured analysis uses a series of phase, called the systems development life cycle (SDLC) to plan, analyze, design, implement, and support a n information system. Structured analysis relies on a set of process models that graphically describe a system. Process modeling identifies the data flowing into a process, the business rules that transforms the data, and resulting output data flow. Structured analysis is developing into a technique called information engineering. Information engineering, like enterprise computing, envisions the overall business enterprise and how corporate data and processes interact throughout the organization.
2. Object-Oriented Analysis
Whereas structured analysis regards processes and data as separate components, object-oriented (O-O) analysis combines data and the processes that act on the data into thing called objects. Systems analysts use O-O methods to model real-world business processes and operations. The result is a set of software objects that represent actual people, things,
transactions, and events. Using an O-O programming language, a programmer then transforms the object it into reusable code and components.
An object is member of a class, which is collection of similar objects. Objects posses characteristics called properties, which it inherits from its class or possess on its own. In O-O programming, built-in processes called methods can exchange an object’s properties. For example, a sailboat object might have a property named sailing speed that can be changed by methods that raise and lower its sails. One object can send information to another object by using a message.
A message can request specific behavior or information from the recipient. For example, if there if there is no wind, a sailboat owner object might send a “start the motor” message to the sailboat object. The owner object has the capability to send this message, and the sailboat object knows what action to perform when it receives he message. O-O analysis uses object models to represent data, behavior, by what means objects affects other objects. By describing an objects (data) and methods (processes) needed to support a business operation, a system developer can design reusable components that allow faster system implementation and decreased development cost. Many analysts believe that, compared with structured analysis, O-O method are more flexible, efficient, and realistic in today’s dynamic business
environment. Also O-O analysis provides an easy transition to popular O-O programming languages, such as Java C++.
3. Other development strategies
In addition to structured analysis and O-O methodologies, you might encounter other systems development techniques created by individual companies. For example, Microsoft has developed an approach called Microsoft Solutions Framework (MSF), Using MSF, you design a series of models, including a risk of management model, a team model, and a process model, among others. Each model has a specific purpose and outputs that contribute to the overall design of the system. Although the Microsoft process differs from the SDLC
phase-oriented approach, MSF, developers do the same kind of planning, ask the same kind of fact-finding question, deal with the same kinds of design and implementation issues, and resolve the same kinds of problems. MSF uses O-O analysis and design concepts, but also examines a broader business and organizational context that surrounds the development of an
information system. Companies often choose to follow their own methodology. By using
powerful CASE tools, an IT staff can apply a variety of techniques rather than being bound to a single, rigid methodology.


